Geotab, a global leader in connected operations, video telematics and AI-powered insights, today published new findings from its European Urban Freight Efficiency Index on road safety, showing that the number of harsh driving events per trip varies more than fivefold across seven European capitals.
The analysis uses GPS-derived harsh acceleration, harsh braking and harsh cornering events from more than 130 million trips by Geotab-connected vehicles in 2025. Berlin records the fewest harsh events at 225 per 1,000 trips, followed by Dublin (315), Amsterdam (356), Rome (393) and London (462). Madrid (1,088) and Paris (1,191) sit far above the rest, at roughly one harsh event for every trip, with drivers in Paris 3.8 times more harsh events per trip than drivers in Dublin.
Dublin also ranks in the top four for overall freight efficiency, alongside Berlin, Amsterdam and Rome. Across the study the two tend to move together: safety and efficiency. The four most efficient cities are the four with the fewest harsh events, while the three lowest-scoring cities record the three highest rates. Two cities sit awkwardly within that pattern. Paris records the most harsh events per trip despite scoring higher than London and Madrid, and London’s rate is less than half of Madrid’s despite a score of 29.
Where events happen matters too. All three of Dublin’s busiest areas sit on a single road, the Naas Road (N7), while Amsterdam has the most concentrated pattern in the study, with three busiest areas holding 13.7% of the city’s harsh events. In cities such as London, by contrast, events are spread widely across the network.
Dublin: one corridor stands out
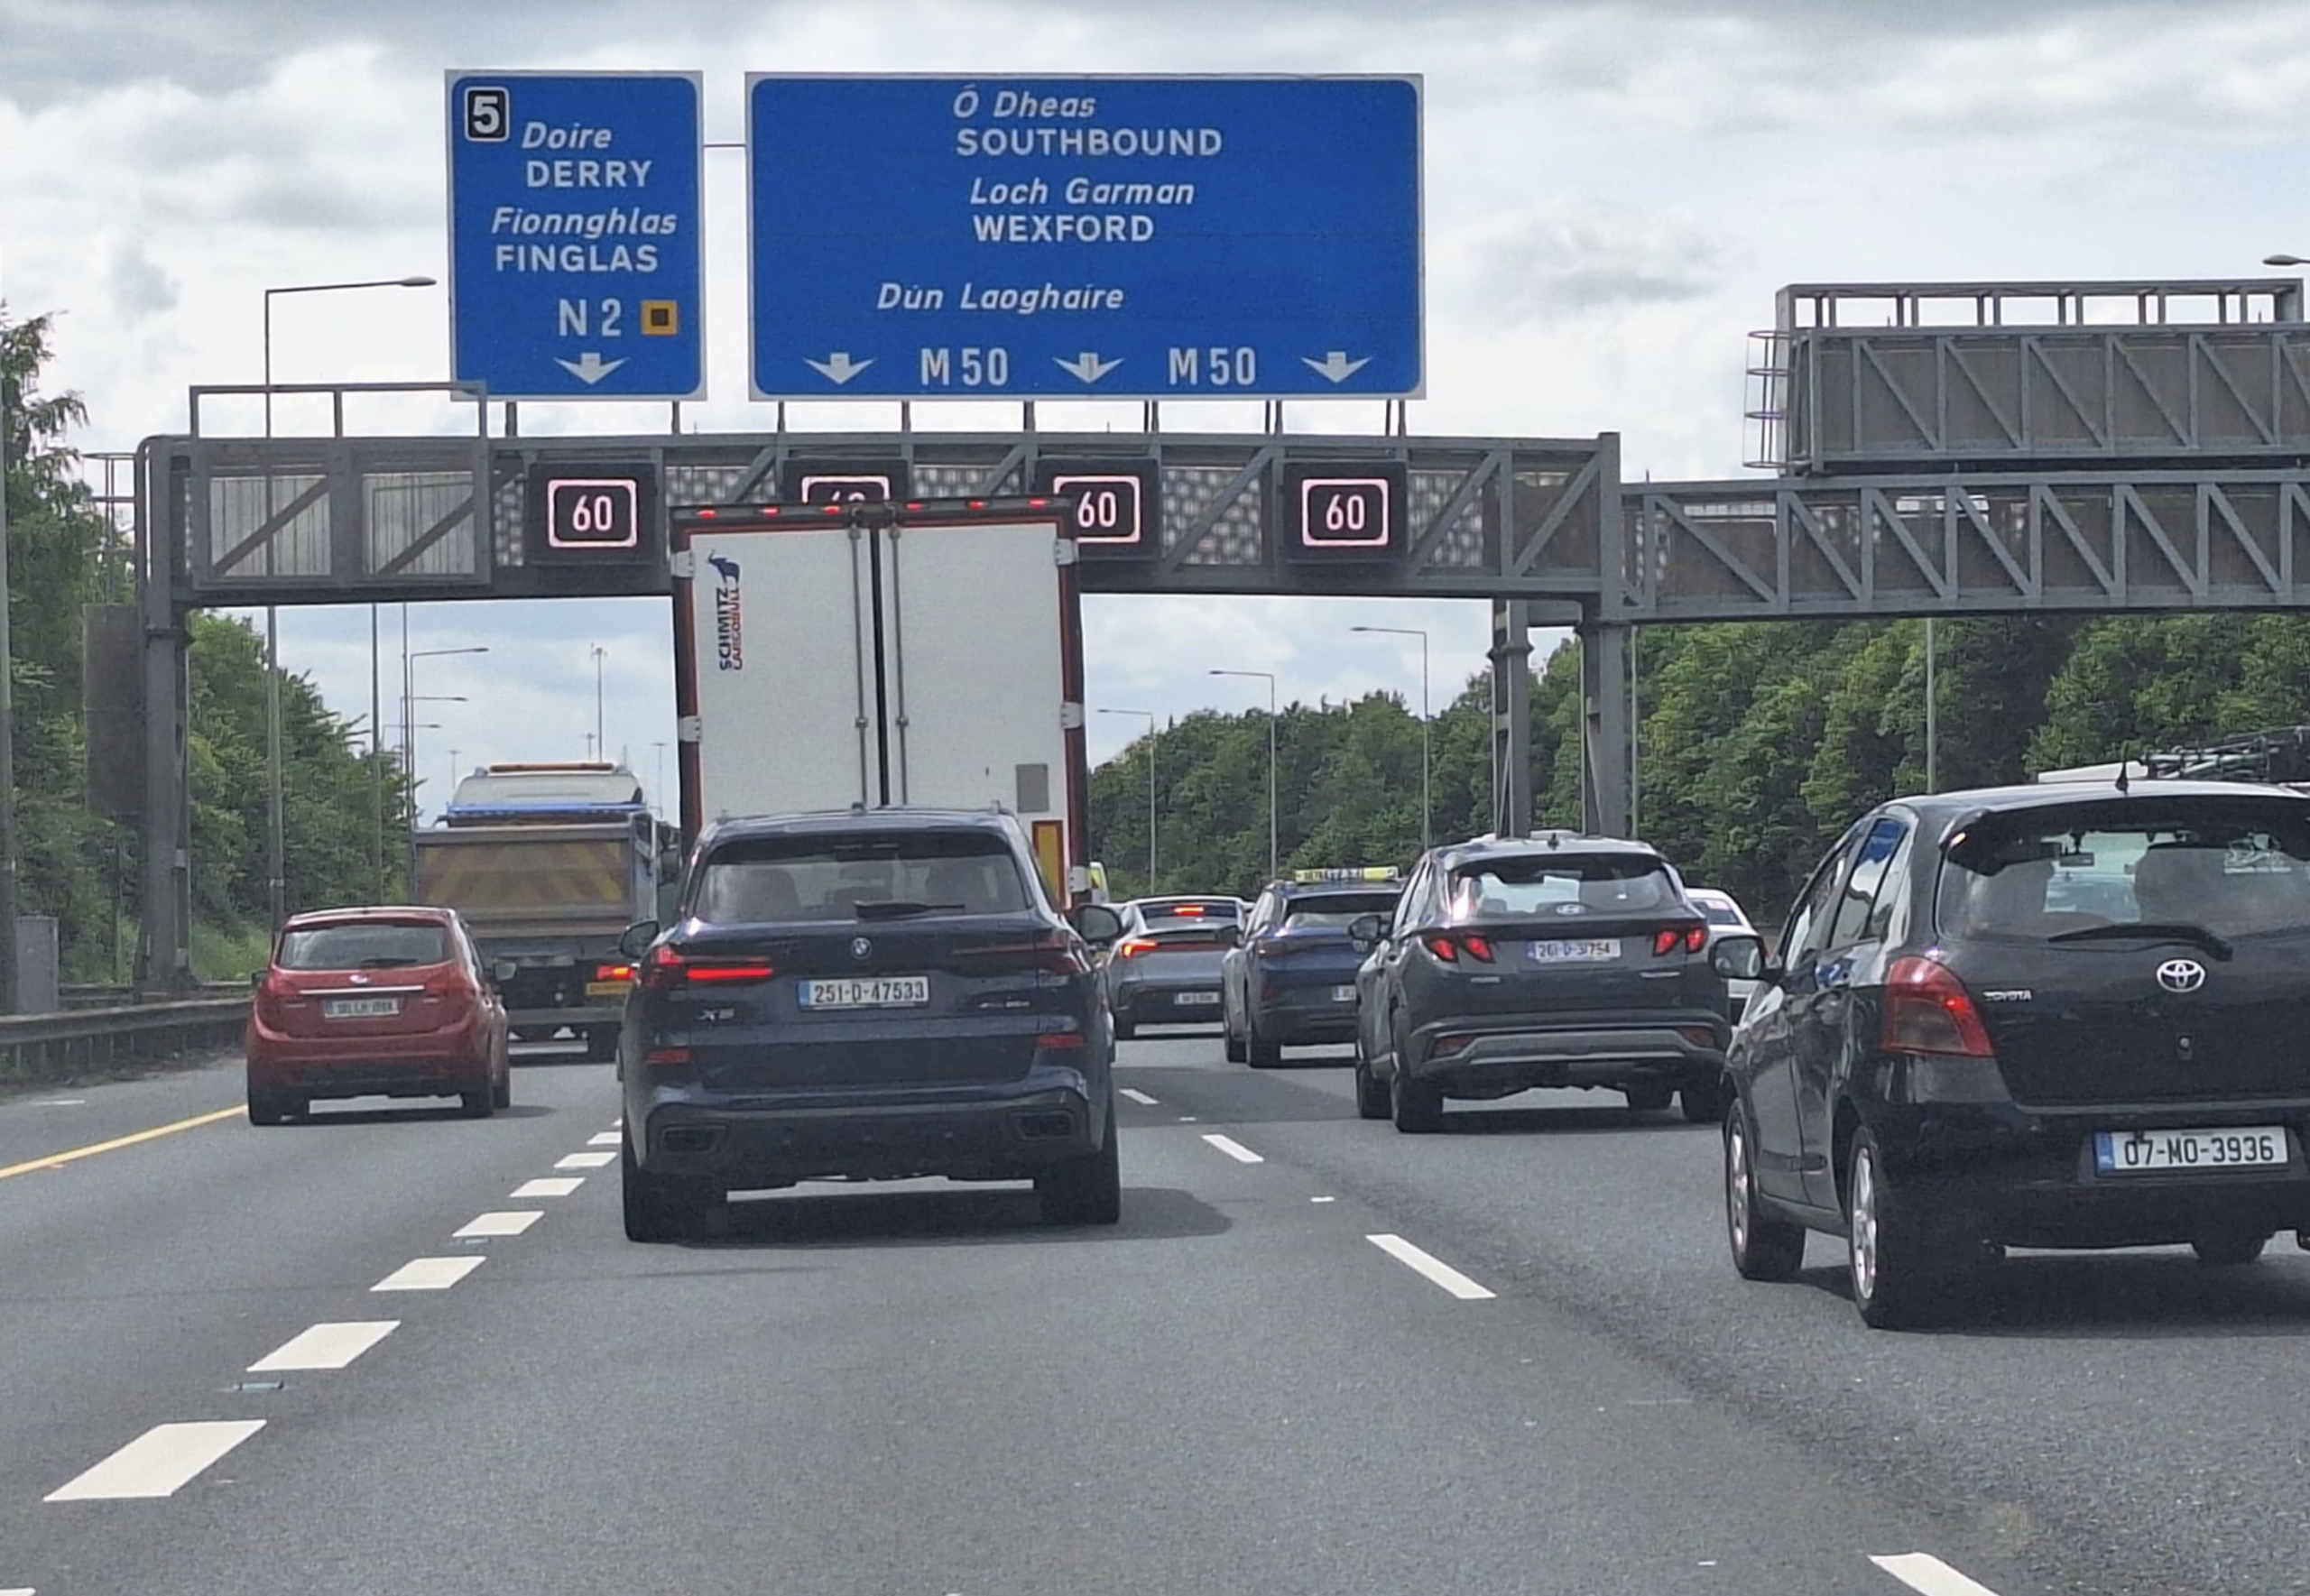
Dublin’s safety picture comes down to a single corridor. The Naas Road (N7) through Walkinstown and Drimnagh holds all three of the city’s busiest areas for harsh driving, at 2.3%, 1.9% and 1.4% of Dublin’s total events. In the worst of the three, 71% of events are harsh cornering.
That makes the N7 an outlier against the rest of the city. Across Dublin as a whole, harsh acceleration leads at 49% of events against 32% for braking. The roundabouts, tight ramps and merge points along the route are the likely explanation, and routing that avoids the stretch at peak times should cut exposure without any change to the road itself.
For context, Amsterdam shows the most concentrated pattern in the study, with three areas on the A4 approach to Schiphol holding 13.7% of the city’s events. London sits at the other end, its busiest area accounting for just 0.6%.
- Every key deadline: diesel rebate, fuel excise, carbon tax
- Tick-box checklist for tacho, CVRT, CPC & operator licence
- Where drivers get caught at RSA roadside checks
Berlin: the only city ahead of Dublin
Berlin records 225 harsh events per 1,000 trips, roughly one event every four to five trips. Acceleration (45%) and braking (44%) are almost evenly matched and cornering accounts for only 10%, which fits the city’s wide, straight boulevards. Its polycentric layout spreads demand across the network rather than funnelling it through one centre, and its busiest areas each hold about 2% of events.
Dublin’s rate is close to Berlin’s but its profile is more uneven: more acceleration, and a cornering problem concentrated on one road rather than spread thinly.
Paris: 3.8 times Dublin’s rate
Paris records 1,191 harsh events per 1,000 trips, 3.8 times more harsh events than in Dublin. This is the highest in the study and roughly one event per trip. Harsh acceleration accounts for 79% of events, with braking at 15% and cornering at 6.5%, the most acceleration-heavy profile of the seven cities, pointing to rapid take-off from a standstill. Its busiest area is near the Porte de la Chapelle interchange (1.8% of events), and events peak at 19:00, later than in any other city. Paris ranks fifth of seven on efficiency, so its safety result is weaker than its efficiency score alone would predict
What it means for Irish fleets
The comparison between cities has a practical use for fleet managers. The type of event matters as much as the count. An acceleration-heavy profile, as in Paris and across most of Dublin outside the N7, tends to respond to driver coaching and in-cab feedback. A profile built on braking and cornering, as on the Naas Road, more often points to junction design and routing. For fleets operating in Dublin that means two separate jobs: coaching on acceleration across the city, and route planning around one corridor.
Phil Barnes, Business Development Manager at Geotab, said: “A harsh event rate only means something when you know which city the driver is working in. The same number can be an average day in Madrid and a warning sign in Berlin. Where the pattern is sudden acceleration, coaching and in-cab feedback can make a real difference. Where it is sharp cornering at a particular junction, a change of route will often do more. Fleets that can see which of the two they are dealing with are in a much better position to act. That is what data and benchmarking make possible: they turn a city-level pattern into something a fleet can act on. Video telematics can also add the context behind an individual event, so a coaching conversation can start from what actually happened on the road.”